
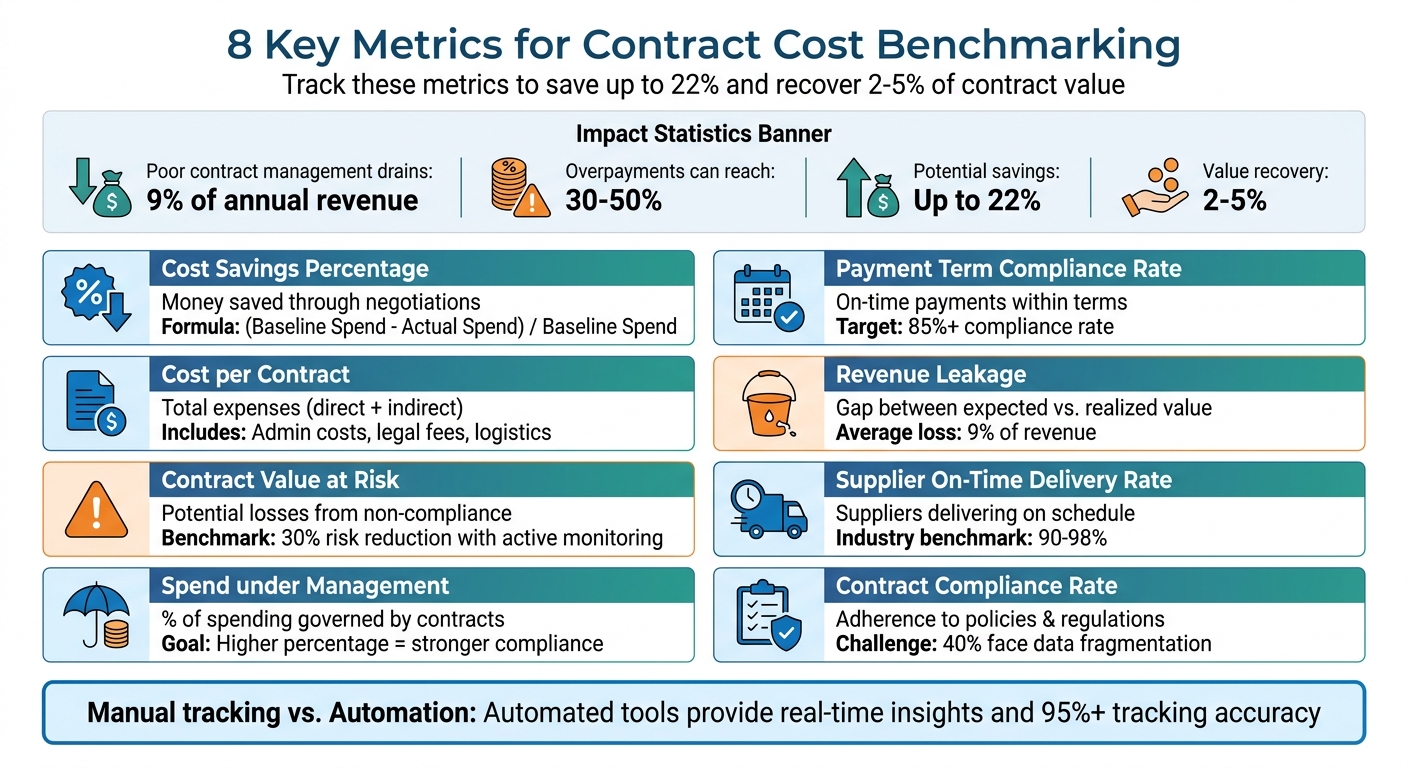
Managing contract costs effectively is critical for protecting your business’s revenue and reducing financial risks. Poor contract management can drain up to 9% of annual revenue and lead to overpayments of 30–50%. However, tracking the right metrics can help you save up to 22% and recover 2–5% of contract value. Here’s a quick breakdown of the most important metrics to focus on:
- Cost Savings Percentage: Measures money saved through negotiations or process improvements.
- Cost per Contract: Tracks total expenses (direct and indirect) for managing contracts.
- Contract Value at Risk: Identifies potential losses from non-compliance or missed deadlines.
- Spend under Management: Shows the percentage of spending governed by active contracts.
- Payment Term Compliance Rate: Monitors on-time payments to avoid penalties and maintain supplier relationships.
- Revenue Leakage from Contracts: Highlights gaps between expected and realized contract value.
- Supplier On-Time Delivery Rate: Tracks how often suppliers deliver goods as scheduled.
- Contract Compliance Rate: Ensures adherence to internal policies and external regulations.
Switching from manual tracking to automated tools like Trackado can streamline processes, improve accuracy, and provide real-time insights. These metrics allow businesses to make data-driven decisions, reduce inefficiencies, and improve profitability.
8 Essential Contract Cost Benchmarking Metrics for SMBs
Core Metrics for Contract Cost Benchmarking
Understanding the right metrics is key to successful contract cost benchmarking. These metrics shed light on areas where costs are being wasted and where better practices can lead to savings.
Cost Savings Percentage
This metric measures how much money is saved through negotiations or process improvements. The formula is simple: (Baseline Spend – Actual Spend) / Baseline Spend. For instance, if your baseline spend was $100,000 and you reduced it to $85,000, your savings percentage would be 15%.
Having accurate, centralized data makes it easier to establish a solid baseline, which is essential for improving efficiency. In the SaaS world, about 65% of providers set liability limits at two times or more the annual fees, giving negotiators a solid advantage backed by data.
"Tracking procurement savings benchmarks alongside operational KPIs helps quantify how sourcing improvements translate into measurable cost reductions." – Ivalua
Regular benchmarking ensures you stay on top of evolving savings opportunities. The next step is to evaluate costs by calculating the total expense per managed contract.
Cost per Contract
This metric captures the total cost of managing a contract, including both direct and indirect expenses. It goes beyond just the invoice amount and takes into account administrative costs, legal fees, and logistics. High costs per contract often point to inefficiencies like bottlenecks or fragmented data systems.
To get an accurate measure, include all source-to-pay process costs. Using advanced analytics and automating processes can help lower these expenses. Consolidating systems is another effective way to cut costs.
Contract Value at Risk
This metric helps track the percentage of contract value that could be lost due to issues like non-compliance, missed deadlines, or underperformance. Companies that actively monitor risk metrics reduce overall contract risk by 30% compared to those relying on manual processes.
Here’s a simple framework for tracking contract value risk over time:
| Timeframe | Value at Risk Level | Action Required |
|---|---|---|
| 30 Days | Critical | Immediate review and direct outreach |
| 90 Days | High Priority | Renewal or termination discussion |
| 6 Months | Moderate | Relationship "happiness check" |
| 12 Months | Standard | Portfolio and strategy review |
Keep an eye on concentration risk too. If a single vendor or customer accounts for more than 20-30% of your contract value, your business could face serious disruptions. Using AI and OCR tools to digitize older documents can help uncover hidden liabilities and improve visibility.
Spend under Management
This metric measures the percentage of your organization’s spending that is governed by active, documented contracts. A higher percentage indicates stronger compliance. Linking this metric to outcomes like defect rates or cost savings can provide deeper insights.
If a significant portion of your spending isn’t managed, it’s a clear opportunity to tackle maverick spending and negotiate better terms.
Payment Term Compliance Rate
Paying suppliers on time is crucial for maintaining good relationships and ensuring smooth cash flow. This metric tracks the percentage of payments made within the agreed contract terms. Late payments can lead to strained supplier relationships, penalty fees, and cash flow problems. Aim for at least 85% on-time payments to avoid these issues.
Set up automated alerts at 90, 60, and 30 days before payment deadlines. Escalation workflows can also help ensure no payment tasks are missed. By 2026, the goal for top-performing organizations is to achieve 85-90% on-time renewals, which requires staying ahead of schedules and deadlines.
sbb-itb-49df6ae
Additional Metrics for Deeper Analysis
Expanding beyond the basics, these metrics help uncover hidden costs and sharpen financial management. They’re especially beneficial for SMBs aiming to improve financial controls and build stronger vendor partnerships.
Revenue Leakage from Contracts
Revenue leakage represents the gap between the expected and actual value of a contract. The formula is simple: Expected Value – Realized Value. On average, businesses lose around 9% of their revenue due to this issue. Surprisingly, most of this leakage occurs after contracts are signed, not during negotiations. Issues like scope creep or missed renewal opportunities often cause the shortfall.
Revenue leakage is particularly insidious because most of it happens after contracts are signed – through missed renewal opportunities, scope creep, and pricing terms that quietly drift from what was agreed.
To combat this, consider these strategies:
- Use standardized contract templates with pre-approved legal language.
- Conduct quarterly performance reviews to ensure pricing terms and volume targets are being met.
- Transition from static PDF contracts to a searchable repository. This allows renewal dates and payment terms to be stored as structured data for easier tracking.
Supplier On-Time Delivery Rate
This metric measures how often suppliers deliver goods on schedule. Delays can lead to costly issues like expedited shipping fees, excess safety stock, and even production halts. Industry benchmarks for on-time delivery typically range between 90% and 98%. For example, one manufacturer boosted their on-time delivery rate from 76% to 99% by centralizing purchase order management and automating alerts, which ultimately reduced inventory costs by 32%.
"On-time delivery (OTD) is not just a logistics metric – it is a reflection of supplier reliability, procurement discipline, and collaboration effectiveness." – SourceDay
To improve this metric, you can:
- Require suppliers to formally acknowledge purchase orders to ensure documented commitments.
- Focus on high-spend, long lead-time, or sole-source suppliers to monitor delays that could have the largest impact on your operations.
Contract Compliance Rate
This metric evaluates how well contracts adhere to internal policies and external regulations, helping to minimize legal and financial risks. A significant challenge here is data fragmentation, which affects 40% of organizations and makes tracking compliance difficult.
To improve compliance tracking:
- Conduct audits to establish a baseline compliance rate.
- Use AI or OCR (Optical Character Recognition) tools to convert contract data into structured formats, significantly improving tracking accuracy over manual methods.
- Centralize contract storage to reduce fragmentation and quickly identify non-compliant agreements.
- Apply standardized risk scoring based on factors like contract value, regulatory requirements, and indemnification terms to prioritize high-risk agreements.
Regular compliance audits can further ensure that you’re staying ahead of potential legal or financial liabilities. Centralizing and streamlining your processes makes it easier to catch issues before they escalate.
Tools for Tracking Contract Metrics
Using Trackado for Centralized Contract Management
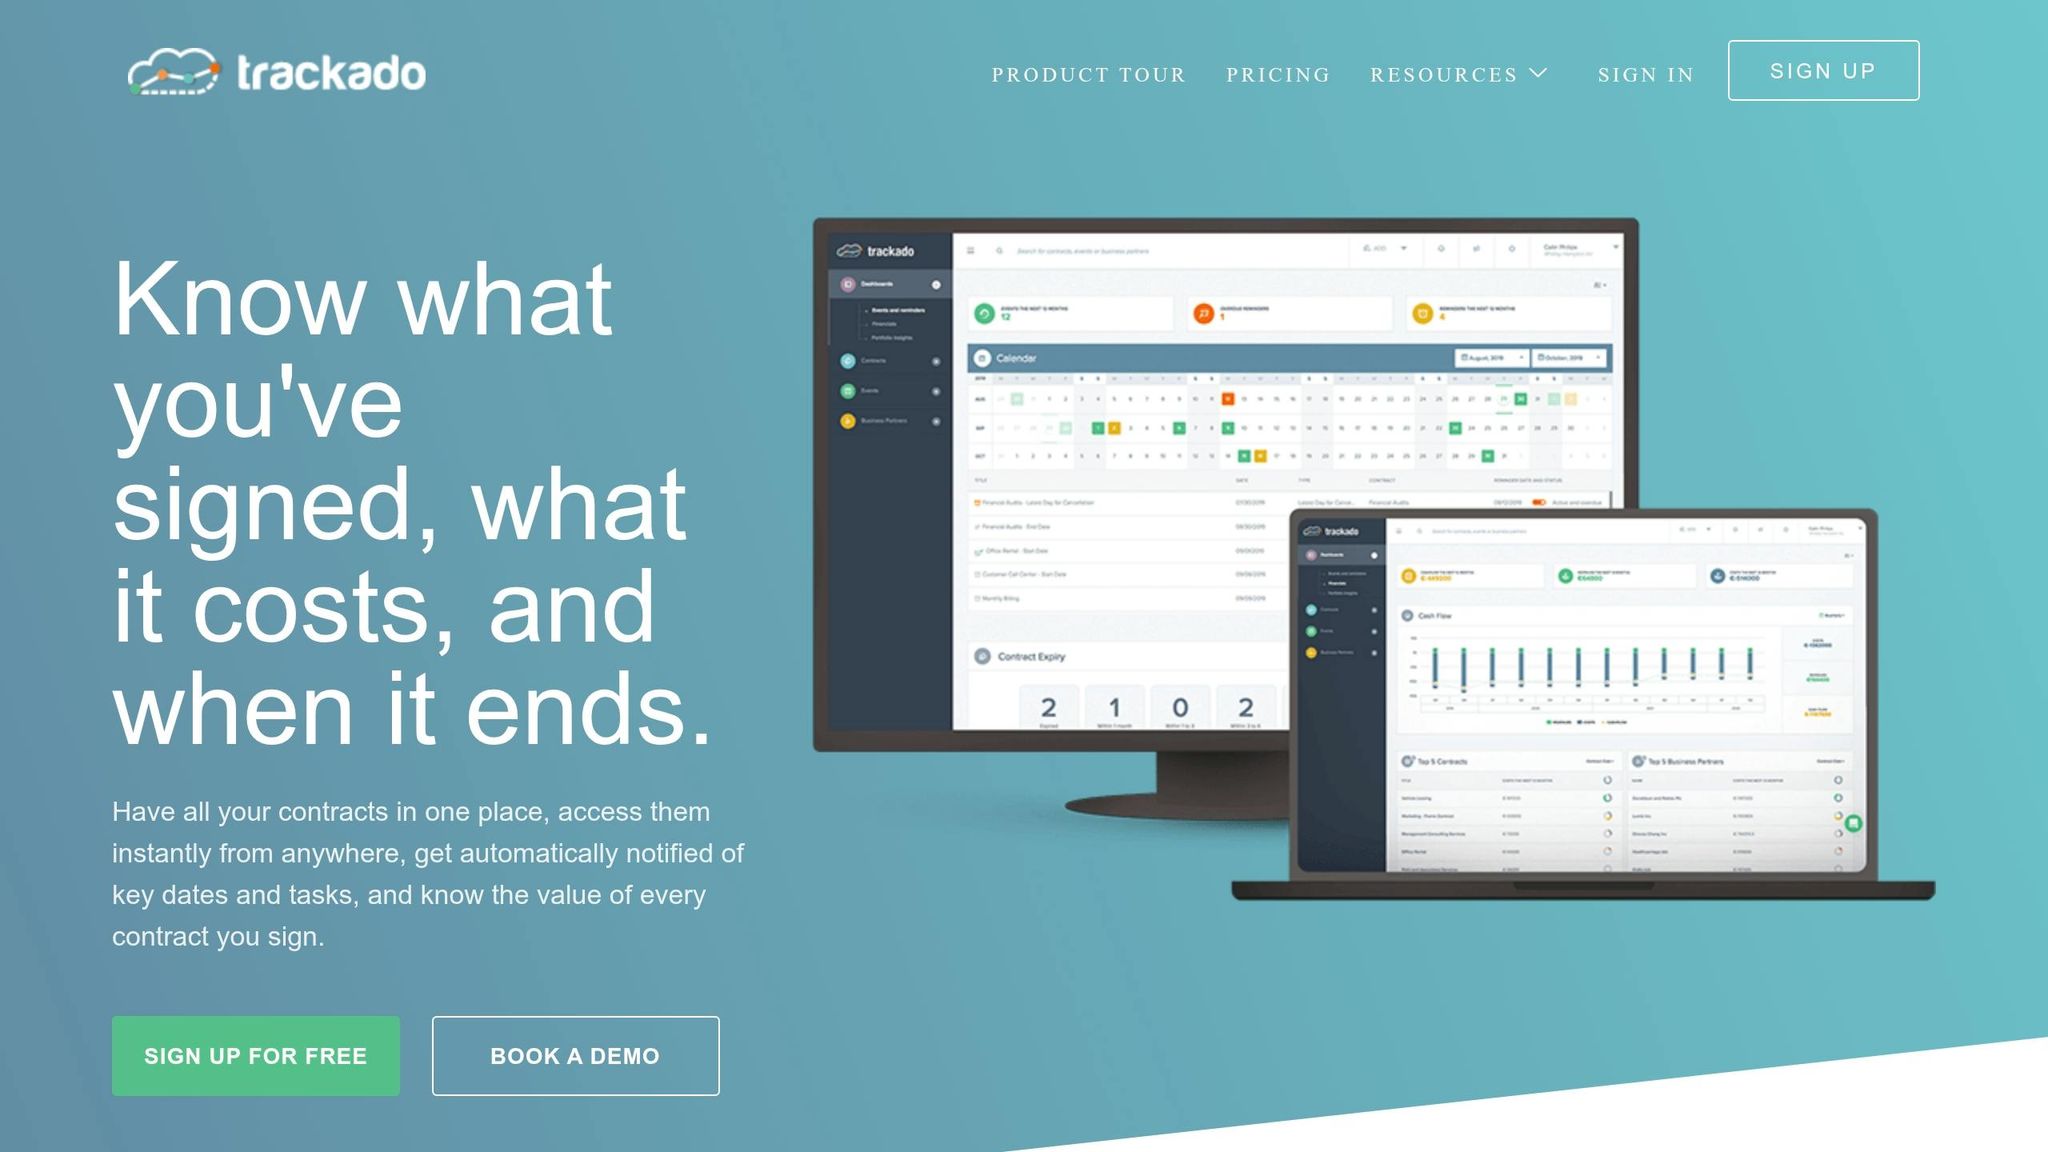
For many small and medium-sized businesses (SMBs), managing contracts often starts as a disorganized process – agreements scattered across emails, local drives, and spreadsheets. This fragmented approach not only wastes time but also increases the risk of missed deadlines and errors. A centralized contract management platform can change all of that by consolidating everything into one reliable source of truth.
Trackado is one such platform, offering a streamlined repository where contracts can be organized by partner, category, or department. It uses AI-powered metadata extraction to pull key details like payment terms, renewal dates, and pricing clauses from unstructured documents. This turns messy files into structured, searchable information.
The platform also keeps teams on track with automated reminders for payment deadlines or when contracts deviate from expected timelines. Customizable fields allow businesses to monitor specific metrics, such as costs tied to individual contracts. Meanwhile, its dashboard provides real-time insights into contract performance, enabling users to track metrics like payment term compliance and overall cost efficiency. For instance, a global hotel group with properties across multiple continents relies on Trackado to manage contracts across locations, ensuring consistency without the complexity of enterprise-level systems.
Designed for easy implementation, Trackado delivers value quickly – a crucial feature, especially since nearly 40% of first-time contract lifecycle management (CLM) buyers switch systems within three years due to overly complicated tools.
This centralized system lays the groundwork for understanding why automation is a game-changer compared to manual tracking.
Manual Tracking vs. Automation
When you compare manual tracking to automation, the advantages of automated tools become strikingly clear. The key differences lie in accuracy, speed, and scalability. Manual methods, like spreadsheets, demand constant updates and are prone to errors. Inconsistent file naming and reconciliation issues across departments are common. On top of that, manual reports can quickly become outdated as market conditions and supplier relationships evolve.
| Aspect | Manual Tracking | Automated Tracking |
|---|---|---|
| Data Storage | Scattered across emails and files | Centralized, structured repository |
| Reporting | Static, quickly outdated reports | Real-time, always up-to-date insights |
| Accuracy | High risk of errors | Consistent and automated data handling |
| Obligation Tracking | Relies on memory and calendar notes | Automated alerts and data extraction |
| Scalability | Becomes unmanageable as volume grows | Built to handle growth and complexity |
Automation tools provide continuous monitoring and benchmarking directly within daily workflows. Unlike annual surveys or occasional reports, this real-time approach helps SMBs uncover cost-saving opportunities faster and address contract performance issues before they escalate.
Conclusion
Tracking key contract metrics like cost savings percentage, contract value at risk, and payment term compliance rate equips SMBs to shift from reacting to problems to making proactive, data-informed decisions. Regularly measuring these metrics helps identify risks and spot deviations early, well before they disrupt negotiations.
The key to success lies in replacing outdated, manual tracking methods with automated systems. Automated benchmarking transforms contracts from administrative overhead into a source of genuine business insight – helping SMBs catch cost overruns, missed renewals, and compliance gaps before they become problems.
Companies leveraging continuous benchmarking and advanced analytics see far better results in efficiency and value creation compared to those relying on traditional tools.
For SMBs, speed is a game-changer. Acting on metrics within 24 hours can improve resolution times by 35%. Achieving this requires a centralized system that delivers real-time insights instead of static, outdated reports. Tools like Trackado make this possible, offering features such as AI-powered metadata extraction, automated alerts for deviations, and customizable dashboards – all starting at $39/month. The platform is designed to provide measurable results in days, not months.
With automated tools offering instant insights, the next step is to refine your analytical approach. Shifting to continuous benchmarking allows businesses to objectively assess risk across their entire contract portfolio. This not only reduces costs but also speeds up revenue generation by smoothing out negotiations and fostering trust with partners.
FAQs
What’s the best baseline to use for cost savings?
Defining clear, measurable procurement KPIs is a smart starting point for identifying cost-saving opportunities. Metrics like cost-per-purchase order (PO) and cycle time can provide a solid foundation. To get meaningful insights, compare your current performance against these benchmarks using real-time data. Leveraging a modern procurement platform can make tracking and analyzing these metrics much easier.
How do I calculate cost per contract accurately?
To figure out the cost per contract, simply divide the total contract costs by the number of contracts. Make sure to include all relevant expenses – like administrative fees, legal costs, and any other associated charges – and stay consistent in how you calculate these costs.
Keeping an eye on metrics such as total spending and contract volume over time can also improve accuracy. This method not only helps you pinpoint costs but also gives you useful insights for benchmarking and managing expenses more effectively.
Which contract metrics should I track first?
To get a handle on procurement performance, start by keeping an eye on two important metrics: cost-per-purchase-order (PO) and cycle time. These numbers give you a solid look at how cost-efficient your processes are and how quickly things are moving. They’re key to spotting where improvements might be needed.