
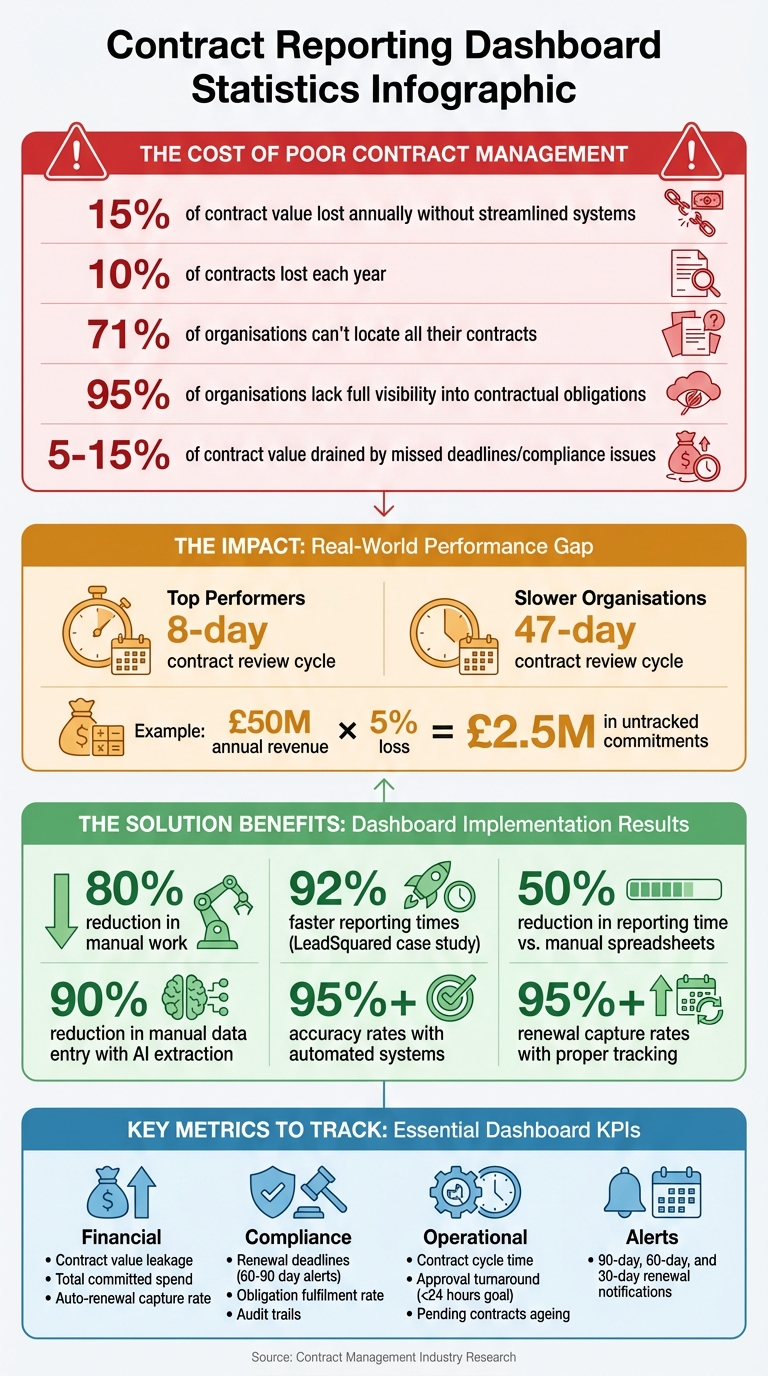
Managing contracts without a streamlined system can cost businesses up to 15% of contract value annually and result in 10% of contracts being lost each year. A contract reporting dashboard solves this by consolidating all contract data into one centralized, real-time interface. It provides instant visibility into statuses, deadlines, and financial obligations, helping organisations reduce risks, improve compliance, and save time.
Key Takeaways:
- Centralised Data: Combines contracts from scattered systems into one searchable hub.
- Automated Alerts: Flags upcoming expirations, compliance issues, and approvals.
- Real-Time Insights: Tracks contract value, manage contract renewals, and obligations.
- Efficiency Gains: Reduces manual work by up to 80% and shortens contract cycles.
With tools like Trackado, businesses can automate contract management, monitor key metrics, and avoid missed deadlines or financial losses. Whether you’re managing $50,000 or $50 million in contract value, a dashboard simplifies oversight and decision-making.
Contract Management Dashboard Benefits: Key Statistics and ROI Metrics
Benefits of Contract Reporting Dashboards
Better Visibility and Organisation
Traditional filing systems often fall short – 71% of organisations admit they can’t locate all their contracts. A dashboard changes the game by pulling agreements from scattered legacy systems into one central, searchable hub. No more digging through folders or chasing colleagues for updates. Instead, teams can filter contracts by criteria like vendor name, contract value, or expiry date in seconds.
Features like Kanban boards and progress bars make it easy to see where each contract stands – whether it’s in draft, under review, or finalized. For small and medium-sized businesses juggling multiple agreements, this clarity can be a game-changer. Take LeadSquared, for instance: by 2026, they slashed reporting times by 92% after adopting a centralized dashboard, gaining instant insight into contract statuses that were previously scattered. Plus, role-based access ensures that each department sees only the data relevant to them, balancing security with transparency. This streamlined organisation also sets the stage for stronger compliance practices.
Improved Compliance and Risk Management
Missing deadlines or compliance requirements can drain 5–15% of a contract’s value. Dashboards help prevent this by automating alerts for key dates – like 30, 60, or 90 days before a contract expires – giving teams ample time to act. This prevents last-minute scrambles, unwanted auto-renewals, or service interruptions.
But it’s not just about deadlines. Dashboards also monitor obligations like delivery milestones and service level agreements (SLAs), ensuring both parties stick to their commitments. Complete audit trails and version histories provide the documentation needed for regulatory checks and internal governance. Considering that 95% of organisations lack full visibility into their contractual obligations, automated risk flagging becomes crucial. By identifying risks early, teams can focus on making informed, data-driven decisions instead of firefighting.
Better Decision-Making with Real-Time Data
While monthly reports show what has happened, real-time dashboards reveal what’s happening now. This shift allows teams to act on trends or anomalies – like sudden drops in renewal rates or payment delays – as they occur. Finance teams can instantly track contract value realisation, while legal teams get immediate alerts on policy breaches or audit risks.
The benefits are clear: organisations that switch from manual spreadsheets to automated dashboards cut reporting time by 50%. More importantly, faster access to data shortens decision-making cycles, enabling businesses to respond and adapt more quickly. When dashboards are tailored to specific roles – like sales focusing on renewal dates or legal teams tracking compliance metrics – each team gets the insights they need without wading through irrelevant information.
sbb-itb-49df6ae
Key Metrics and KPIs to Track
A well-designed dashboard doesn’t just organize contract data – it brings key metrics into focus, making strategic oversight much easier.
Financial Metrics and Contract Value
One critical metric is contract value leakage, which measures the difference between expected and actual returns. This often happens due to unenforced price increases, missed early payment discounts, or uncollected penalties. Organisations lose between 5% and 15% of a contract’s value after signing because of poor oversight. For a company generating $50 million annually, even a 5% loss translates to $2.5 million in untracked commitments.
Another important metric is the auto-renewal capture rate. This tracks how often teams take action – like renegotiating or terminating contracts – before auto-renewal deadlines. Without this, businesses risk sticking with outdated pricing or paying for redundant services. Meanwhile, total committed spend provides a clear view of financial obligations tied to active contracts, helping finance teams align these commitments with the general ledger. Modern dashboards often use AI to extract financial details from documents like PDFs and employ predictive analytics to flag contracts likely to experience value leakage.
While financial metrics focus on quantifying value, compliance and renewal tracking ensure that value is protected.
Compliance and Renewal Deadlines
Missing deadlines can lead to unwanted auto-renewals and missed opportunities for pricing adjustments. Renewal tracking ensures teams act 60 to 90 days before contract expiration, allowing time to renegotiate terms, secure better pricing, or terminate underperforming agreements. With around 10% of contracts lost annually, systematic tracking is essential.
The obligation fulfilment rate measures how well contractual commitments – like SLAs, delivery milestones, and payment schedules – are met on time. This metric not only helps during regulatory checks but also reduces the risk of breaches escalating into legal or financial issues.
Beyond finances and deadlines, operational metrics shed light on how efficiently processes are running.
Operational Metrics
Contract cycle time, which tracks the time from an initial request to final execution, is a key indicator of efficiency. Top-performing organisations can finalize complex B2B contracts in under two weeks, while the average takes three to four weeks. Approval turnaround time measures how quickly stakeholders review contracts, with a goal of sub-24-hour responses for standard agreements.
Another useful metric is pending contracts ageing, which flags agreements that are taking longer than expected to complete. Weekly reviews of contracts pending for over 30 days help teams take immediate action. Additionally, tracking redline rounds – the number of revision cycles between parties – can highlight inefficiencies. Since the top 20 most-negotiated terms account for over 80% of redlining activity, frequent revisions may point to poor templates or misaligned terms. These operational metrics help identify workload imbalances and pinpoint bottlenecks, whether in legal review or during negotiations with counterparties.
How to Set Up a Contract Reporting Dashboard in Trackado
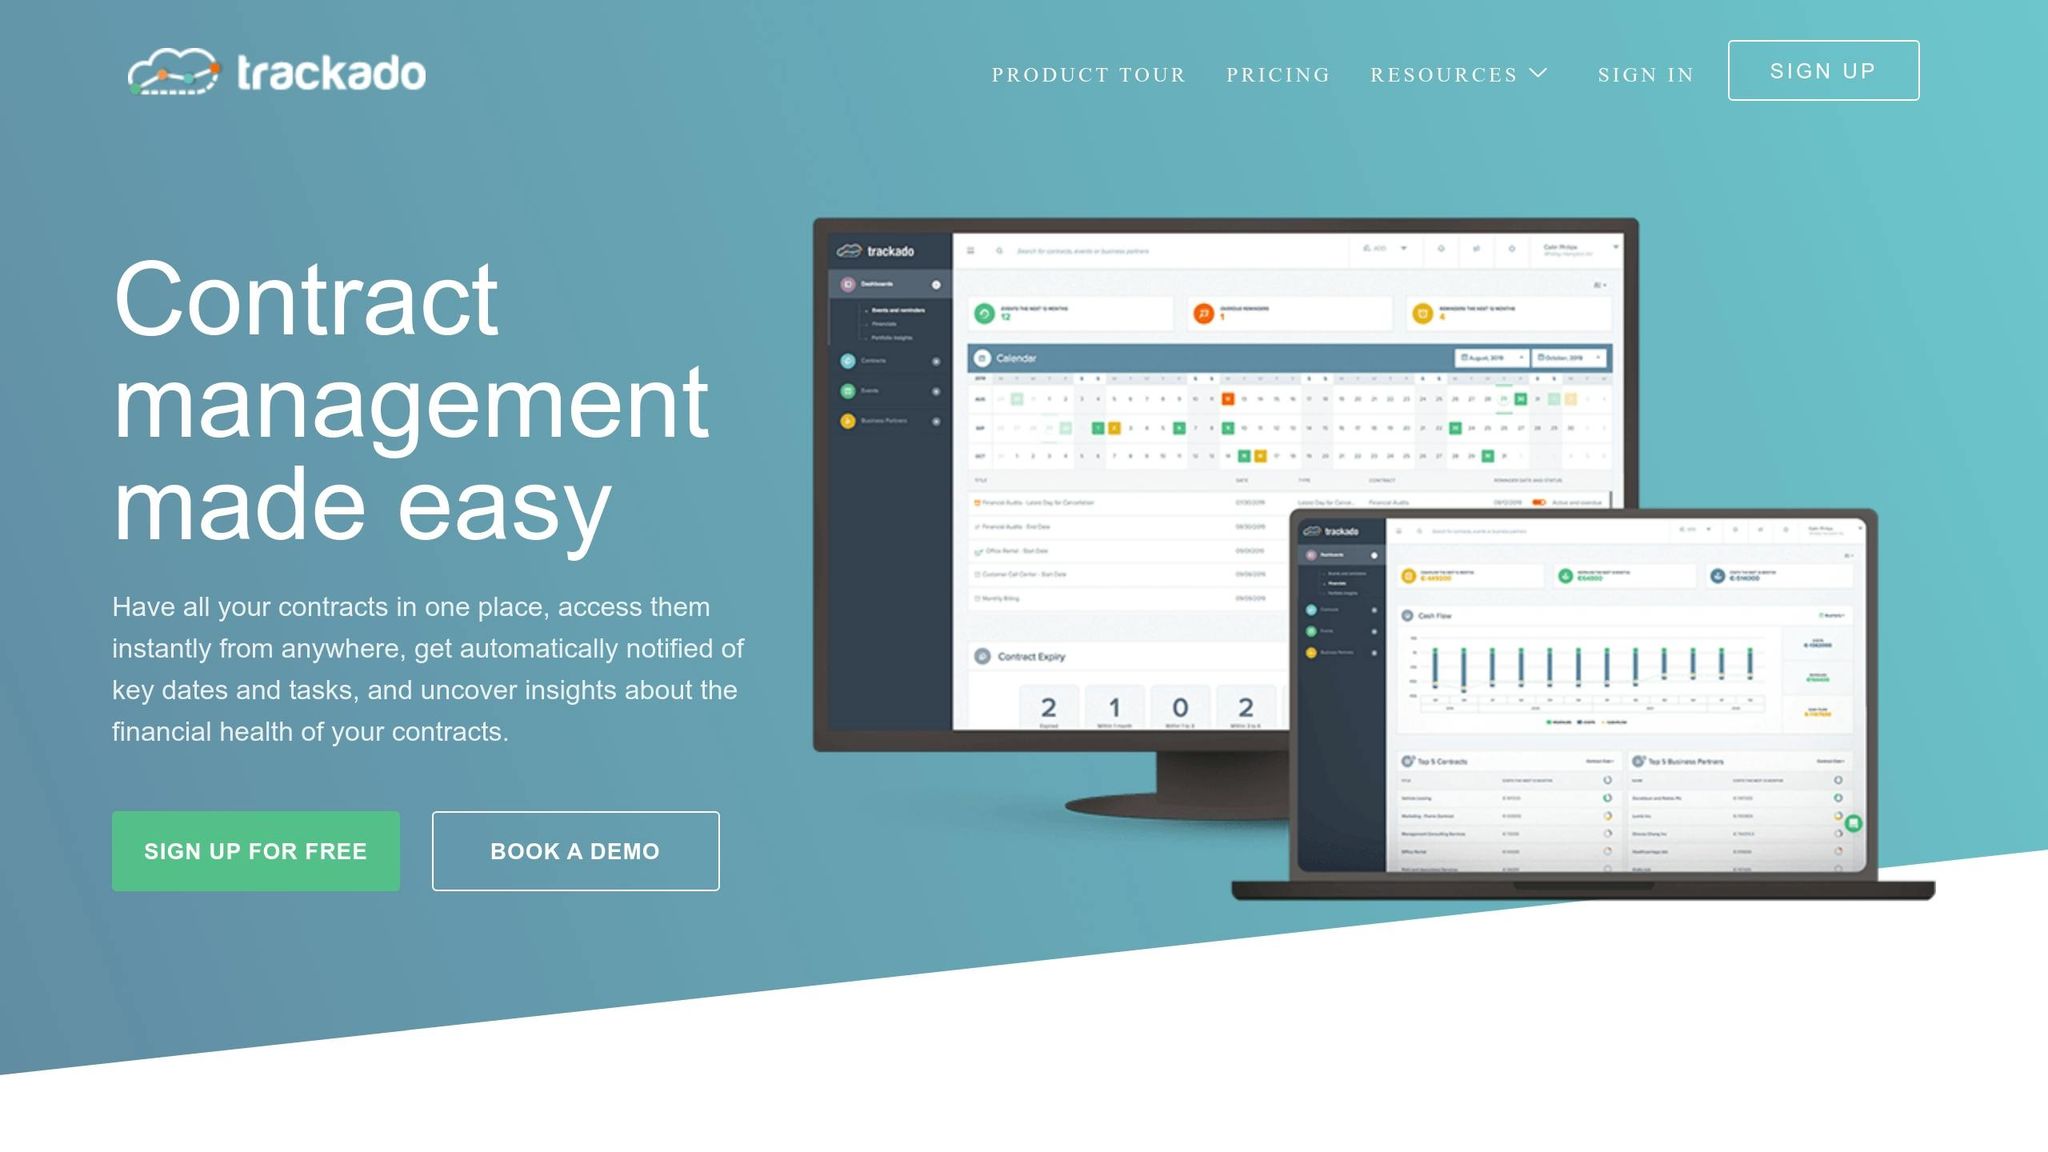
Setting up a custom dashboard in Trackado can help you manage contracts efficiently, whether you’re overseeing $50,000 or $50 million in value. The platform’s user-friendly design simplifies the process, and with a clear plan, you can let its automation features do the heavy lifting.
Define Your Goals and Centralise Your Data
Start by clarifying what you need to track. Different departments will have different priorities – finance might focus on spending, legal teams on compliance, and procurement on supplier performance.
Once you’ve outlined your objectives, upload all your contracts to Trackado’s central repository. You can use the bulk import tool for existing files or connect cloud storage platforms like Dropbox, Google Drive, or OneDrive. Trackado’s AI-powered data extraction automatically identifies key fields such as contract ID, value, start and end dates, and obligations, saving you from manual data entry. For ongoing agreements, enable the "Email-In" feature to allow sales teams to upload new contracts via email.
"Trackado is simple, easy to use, and does exactly what it promises, without unnecessary extras." – Alastair Gilchrist, Chief Technology Officer, NRLA
Ensure your data is clean – standardize vendor names, remove duplicates, and check for missing fields. Clean, organized data is crucial since organisations with well-maintained repositories often achieve significant renewal capture rates.
With your data centralized, you’re ready to customize the dashboard to display your most important metrics.
Customize Your Dashboard for Key Metrics
Trackado allows you to tailor your dashboard using custom widgets. Financial widgets can display metrics like total contract value, renewal rates, and milestone trackers. Filters help you segment contracts by department, status, or partner, while visual aids like pie charts and bar graphs make trends easy to spot – such as compliance distribution or spending patterns.
You can also create custom fields to track specific needs, such as SLA terms, regulatory requirements, or approval stages. In the "Billing Transactions" section, log costs, revenues, and payment obligations for a clear view of financial commitments. For deadlines, the "Events" feature flags key dates like renewals, notice periods, and terminations.
Conditional formatting adds an extra layer of clarity. For example, you can highlight contracts expiring within 30 days in red or flag high-value agreements ($10,000+) that need immediate attention. Use "Categories" and "Organizational Units" to group contracts by department or team for easier reporting.
"The ability to work with our contracts in the repository has made contract admin so much easier!" – Daisy Miller, Project Coordinator, Zapmap
Once your dashboard is set, you can use automated alerts to stay on top of deadlines and tasks.
Set Up Automated Alerts and Workflows
Trackado’s automated alerts notify you 90, 60, and 30 days before renewal deadlines (formatted as DD/MM/YYYY), giving your team time to renegotiate or terminate contracts as needed. Simply activate the "Please remind the contract owner" checkbox in the Lifecycle section to enable notifications.
Approval workflows can also be automated to route contracts for review. Assign tasks for legal checks, finance approvals, or final sign-offs, and use workflow templates for standard agreements. All activities are logged automatically, helping you meet compliance and audit requirements.
"The moment we knew we had made the right choice with Trackado was when we received email notifications that gave us a heads-up when something was ending or renewing. This really helped us to keep on top of things and avoid sticky situations with partners we didn’t want to continue to work with." – Yiannis Karavassilis, COO, CloudKid
Test your alerts with pilot data before rolling them out company-wide. For instance, simulate a 30-day renewal reminder to ensure notifications work as expected. You can also sync alerts with team calendars for better visibility. Regularly review logs to refine your triggers – organisations that focus on high-value contracts first often reach significant compliance rates.
Tips for Getting the Most from Your Dashboard
Set Up Role-Based Access
Not everyone in your organisation needs to see every piece of data on your dashboard. By implementing role-based access, you can ensure that each team only views the metrics relevant to their responsibilities. For example, executives might focus on portfolio value, legal teams on risk scores, procurement on spending patterns, and sales on deal status.
This strategy not only safeguards sensitive information but also reduces dashboard fatigue by filtering out unnecessary details. To keep things streamlined, regularly audit user roles to ensure access aligns with current responsibilities. Shared folders can also help manage visibility across departments effectively.
"Everybody knows no contract can be signed or executed without going through our CLM tool, and every stakeholder has clarity on where the contract is in the pipeline." – Nadia Louis Hermez, Legal Ops Manager, Next Insurance, Inc.
Use Visual Indicators for Quick Insights
Once you’ve tailored access, the next step is to make the data easy to interpret. Tools like traffic-light systems (red, amber, green) are great for highlighting priorities at a glance. For example, contracts expiring within 30 days could be flagged red, those expiring in 30–90 days amber, and everything else green. Similarly, pie charts, line graphs, and bar charts can quickly illustrate contract statuses, real-time contract data trends, or spending comparisons.
To avoid overwhelming users, focus on 5–7 key metrics. Visual aids such as progress bars, Kanban boards, or timeline views can clearly show where contracts are in their lifecycle and flag upcoming renewals. Additionally, presenting KPIs as trends – like comparing this month’s data to last month’s – can reveal whether performance is improving or slipping.
By keeping visuals clean and focused, you ensure that users can spot the most critical insights without distraction.
Keep Your Data Accurate and Up to Date
A dashboard is only as good as the data it displays. If the information is outdated or inaccurate, it can lead to missed deadlines or poor decisions. To avoid this, connect your dashboard directly to your contract repository so that updates happen automatically. AI-assisted data extraction can significantly reduce manual entry with high accuracy rates.
During setup, standardize data formats – for example, use DD/MM/YYYY for dates and consistent vendor naming conventions to eliminate duplicate records. Automated alerts for critical milestones, like 90-day termination windows, can help teams act promptly. Regular data audits are also essential to maintain accuracy and ensure your insights stay dependable.
"A dashboard is only as reliable as its data inputs. Without automated data syncing from your CLM system, dashboards quickly become misleading." – HyperStart Knowledge Suite
Conclusion
Contract reporting dashboards have become a crucial tool for businesses aiming to centralise data, minimize risks, and make quicker, better-informed decisions. Without a unified system, companies face serious challenges: 71% of organisations struggle to locate all their contracts, and around 10% of contracts are lost annually. This lack of organisation leads to missed deadlines, financial penalties, and value losses that can amount to 5% to 15% of a contract’s total worth.
Dashboards solve these issues by consolidating all contract data into a single, searchable repository. This eliminates data silos, ensuring that all stakeholders have access to the same, up-to-date information. With features like automated audit trails, real-time KPIs, and visual alerts, teams can stay on top of contract compliance, renewal deadlines, and risky clauses – preventing minor issues from escalating into expensive legal problems. The impact is clear: top-performing organisations achieve an 8-day contract review cycle, while slower ones take 47 days on average.
Trackado simplifies contract management with AI-powered data extraction, customizable dashboards, and automated notifications, bringing the benefits of dashboards into a secure, easy-to-use platform. Whether you’re monitoring financial metrics, compliance, or operational performance, Trackado keeps everything in one place. With pricing options ranging from a free plan for smaller teams to enterprise packages that support unlimited contracts, it offers a scalable solution tailored to your business needs while providing the transparency and control you require.
FAQs
What should I track on a contract reporting dashboard?
A contract reporting dashboard is a powerful tool for keeping tabs on essential metrics that drive effective contract management. Some of the key areas to monitor include:
- Contract cycle time: Measure how long it takes to finalize contracts, helping to identify bottlenecks and improve efficiency.
- Renewal rates: Track how often contracts are renewed, providing insights into client satisfaction and retention.
- Compliance adherence: Ensure contracts meet regulatory and organizational standards, reducing the risk of penalties.
- Obligation fulfilment: Monitor whether all parties are meeting their contractual commitments.
- Contract value realisation: Assess whether the financial and strategic benefits outlined in contracts are being achieved.
- Performance indicators (KPIs): Keep an eye on performance metrics to evaluate how well contracts are delivering against agreed objectives.
By tracking these metrics, you can spot potential risks, measure progress, and maintain control over the entire contract management process.
How do I calculate contract value leakage from my contracts?
Contract value leakage happens when there’s a gap between the value a contract promises and what’s actually delivered. This can stem from issues like missed renewal deadlines, obligations that aren’t met, or scope creep that extends beyond the original agreement.
To measure this, keep an eye on critical details like renewal dates, payment terms, and contractual obligations. By comparing the revenue you expected to earn with what was actually achieved, you can spot where things went off track. Using AI-powered tools can make this much easier, as they can automate data analysis and flag areas where value might be slipping through the cracks.
How does Trackado extract key fields from PDFs automatically?
Trackado leverages AI-powered data extraction to pull out crucial details from PDFs, including titles, dates, and involved parties. These extracted fields are then available for review, making contract management more efficient by cutting down on manual data entry and saving valuable time.