
Hotels that compare vendor contracts systematically before renewal, using like-for-like scope and normalized unit pricing, consistently find meaningful cost reduction opportunities, often in the range of 20% or more for contracts that haven’t been benchmarked recently.
I look at four steps: match scope, convert spend into clean units, compare against internal and market data, and sort each contract into renegotiate, rebid, consolidate, or hold.
If I only compare the rate on page one, I can miss the parts that drive the total bill. Laundry needs a per-pound and per-use check. F&B needs SKU-level and outlet-level review. Maintenance needs service-line units like per room, per device, or per visit. Tech and insurance need a usage and risk review so I can tell a true price jump from a scope change.
Here’s the article in plain terms:
- Start with like-for-like scope. Two contracts with the same headline price may cover different service levels, pickups, exclusions, or surcharges.
- Normalize spend. Use units like cost per occupied room, minutes per occupied room, price per megabit, per device, or per acre.
- Check the hidden cost drivers. Freight, fuel, turnaround, minimums, rebates, support tiers, deductibles, and claims history can change the total.
- Use more than one benchmark source. Internal history shows property outliers. Market quotes and pooled spend data show where rates should land.
- Review early. I’d start 90 to 180 days before renewal so there’s time to audit usage, test market pricing, and avoid auto-renewal traps.
- Keep the contract and the logic together. Store pricing assumptions, exceptions, and renewal dates in one place so the next review starts with facts.
Quick comparison
| Category | Best unit to compare | Main things to check |
|---|---|---|
| Laundry | Cost per pound, cost per occupied room, cost per use | Turnaround, pickup cadence, linen loss, fuel, fabric spec |
| F&B | SKU price, outlet-level spend, landed cost | Minimums, rebates, substitutions, lead times, freight |
| Maintenance | Per room, per system, per device, per visit | Response times, emergency coverage, exclusions, visit frequency |
| Technology | Price per megabit, per license, per active line | Usage growth, support tier, extra tools, inactive services |
| Insurance | Premium, deductible, total insured value | Claims history, asset type, catastrophe exposure, coverage limits |
Bottom line: if I benchmark hotel vendor deals with the same units, the same scope rules, and the same review cycle every time, it gets much easier to spot overpayment before it rolls into the next term.
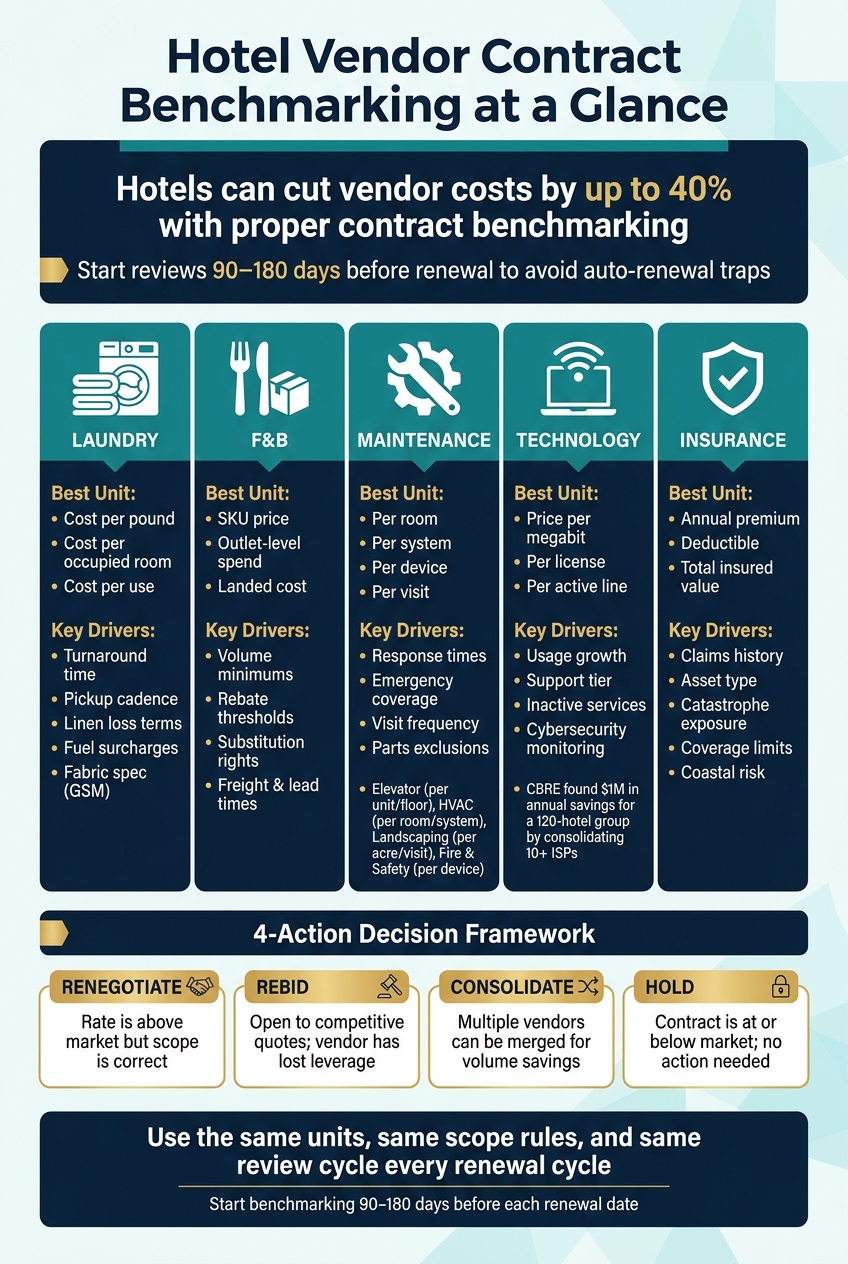
Hotel Vendor Contract Benchmarking: 5 Categories, Key Units & Cost Drivers
Benchmarking laundry and F&B vendor contracts
Start with the benchmark units from above. Laundry and F&B usually have the biggest spread between contracts, and both costs rise and fall with occupancy. That’s why raw invoice totals can mislead you. A cleaner read comes from benchmarking against normalized volume.
Laundry: compare per-pound pricing, turnaround, and linen-risk terms
The per-pound rate gets most of the attention, but it’s only the first layer. To compare contracts across properties, look at occupancy-adjusted volume, turnaround time, pickup frequency, linen loss or damage terms, and landed costs like shipping, handling, and fuel surcharges. Small clauses in those areas can change the total contract cost in a big way.
A better way to benchmark laundry is cost per use: take the unit price, divide it by expected wash cycles, then adjust for towel grade and fabric spec. That matters because not all linens are equal. Standard guest-room towels usually run 500–600 GSM, while spa linens need 700+ GSM. So if one vendor looks cheaper per pound, but the linen spec is heavier or built for a higher service level, that “cheaper” rate may not be cheaper at all.
| Laundry Contract Component | What to Compare |
|---|---|
| Per-pound rate | Base charge and whether landed costs are included |
| Turnaround time | Standard service vs. faster turnaround during peak periods |
| Pickup frequency | Scheduled collection cadence and flexibility during occupancy spikes |
| Linen loss or damage terms | Who absorbs shrinkage, damage, or untracked losses |
| Emergency sourcing | Vendor ability to handle sudden occupancy spikes |
| Linen specs | GSM, thread count, and fabric composition |
Use the same discipline for F&B, but shift the lens. Instead of pounds and turnaround, compare SKUs, outlets, and volume tiers.
F&B: compare ingredient pricing, volume commitments, and outlet-specific terms
F&B pricing changes by outlet and by volume, so one rolled-up total doesn’t tell you much. Benchmark at the SKU level first, outlet by outlet, and then roll everything up to the property level. That keeps the comparison lined up across properties.
Ask vendors to include all freight, handling, and fuel charges in their bids, along with tiered unit and bulk pricing. Then compare annual minimums against spot-order flexibility. A contract with low unit pricing can still box you in if the volume commitment is too high.
Rebate structures matter too, especially the thresholds, payout timing, and conditions attached to them. It also helps to review substitution rights during supply disruptions. If a supplier can swap products too freely, your menu, margin, or guest experience can take a hit. Lead times, backorder policies, and emergency sourcing terms should all be spelled out before renewal.
| F&B Contract Component | What to Compare |
|---|---|
| SKU-level ingredient pricing | Unit price vs. bulk tiers; confirm landed costs are included |
| Minimums | Annual commitments vs. spot-order flexibility |
| Rebates | Thresholds, timing, and conditions |
| Outlet-specific pricing | Differences by outlet or program |
| Substitution terms | How shortages and supply disruptions are handled |
| Lead times and backorders | Standard lead times, backorder policies, and emergency sourcing |
The same benchmarking logic also applies to maintenance, technology, and insurance, where scope and renewal terms often explain why contract costs vary so much.
sbb-itb-49df6ae
Benchmarking maintenance, technology, and insurance costs
Maintenance, technology, and insurance should be benchmarked on unit economics, service scope, and risk drivers – not just total spend.
Maintenance: use per-room and scope-based comparisons across service lines
Once volume-based benchmarking is done, move to service-line benchmarks. Look at maintenance costs per room, system, or device, then compare the scope behind those numbers: response times, visit frequency, emergency coverage, and exclusions. These aren’t side costs. They’re major spend categories.
Each service line has its own best benchmark unit. Elevator contracts are usually compared per unit or per floor, and the fine print matters a lot – especially emergency response windows and excluded parts. HVAC tends to benchmark well on a per-room or per-system basis. Cost gaps often come from visit frequency, filter changes, and predictive AI integration. Landscaping is often measured per acre or per visit, with seasonal rotations and irrigation maintenance driving most of the variance. Fire and life safety contracts are commonly priced per device, where inspection frequency and compliance certification tend to separate one contract from another.
| Maintenance Category | Benchmark Unit | Key Drivers |
|---|---|---|
| Elevator | Per unit / per floor | Response time, emergency coverage, parts exclusions |
| HVAC | Per room / per system | Visit frequency, filter changes, predictive AI integration |
| Landscaping | Per acre / per visit | Seasonal rotations, irrigation maintenance, debris removal |
| Fire & Life Safety | Per device / annual | Inspection frequency, compliance certification, sensor testing |
One more thing: don’t disclose current contract pricing in the RFP. Let vendors bid based on their own cost structure. That puts pressure where it belongs. Properties using this approach, combined with aggregated purchasing power, often see materially lower rates than what stand-alone properties pay negotiating independently.
Technology and insurance: compare renewal cost drivers
Technology renewals are easy to misread. A higher bill doesn’t always mean the vendor increased pricing. Sometimes the jump comes from heavier usage – more guest-facing systems, extra licenses, or a higher support tier. In plain terms, you may be paying more without the base rate changing at all.
That’s why an annual digital audit helps. It separates actual price increases from charges tied to services you’re billed for but no longer use. In 2024, CBRE Network Advisory Services found $1 million in annual savings for a 120-hotel management organization by consolidating more than 10 internet service providers into a single-vendor setup and benchmarking on price per megabit.
Insurance works differently because the comparison has to be adjusted for risk. Annual premium and deductible structure matter, but so do total insured value, claims history, asset type, and any coastal or catastrophe exposure. A beachfront resort and an inland select-service hotel might post similar revenue, yet carry very different insurance risk. Compare premiums without that context, and the numbers can steer you wrong.
| Cost Driver | Technology Renewal | Insurance Renewal |
|---|---|---|
| Usage / Volume | Number of software licenses; guest-facing vs. back-office systems | Total insured value; amenity risk (for example, pools and spas) |
| Service Level | Support tiers, cybersecurity monitoring, training | Deductible structure; claims history; emergency coverage limits |
| True Price | Software license fee hikes; hardware FF&E inflation | Annual premium increases; catastrophe exposure |
| Infrastructure | Bandwidth speeds; price per megabit; integration costs | Asset age; maintenance history (for example, HVAC and elevator condition) |
Use these benchmarks to tell the difference between a justified increase and simple renewal padding.
Turn benchmark data into renewal and negotiation actions
Benchmarking only matters if it leads to a clear renewal call.
Once you have cost comparisons across properties and categories, the next step is simple: decide which contracts to renegotiate, which to rebid, which to combine, and which to leave alone.
Find cost outliers and test the cause first
Not every above-market contract signals a bad deal.
Sometimes the higher cost comes from scope, service level, property layout, or waste inside your own operation. That’s why you should audit the cause before pushing back on the vendor.
It also helps to check for contract terms that push costs up in quiet ways. Auto-renewal clauses can lock you into higher rates. Standing orders may no longer match actual usage. Other terms might reflect how the property worked a year ago, not how it runs today.
Once you know why the contract sits above market, you can sort it into one of four buckets:
- Renegotiate
- Rebid
- Consolidate
- Hold
Build a renewal playbook around deadlines and leverage points
A common mistake is letting high-value contracts auto-renew without a market check.
Contracts for elevator service, landscaping, and laundry should go through a competitive review before auto-renewal. If you skip that step, you lose leverage before the conversation even starts.
Start the review 90 to 180 days before each renewal date. That gives you enough time to confirm current usage, check service scope, and compare current rates against market pricing before the notice deadline hits.
Store contracts, assumptions, and renewal dates in one system
After you make the renewal decision, keep the benchmark and the assumptions with the contract.
If that data is spread across spreadsheets, email threads, and shared drives, it goes stale fast. And when the next renewal shows up, your team has to piece the story back together from scratch.
The logic behind the numbers matters just as much as the numbers themselves. You need a clear record of why a contract was approved above market, what scope changes were made, and which properties had exceptions.
A central contract repository keeps that information in one place. Trackado organizes contracts by property, partner, category, or department, and includes renewal reminders, milestone tracking, approval workflows, and e-signing. Keeping assumptions next to the contract helps preserve comparability across future hotel property renewals.
Conclusion: A repeatable benchmarking system for hotel vendor deals
Benchmark contracts the same way every time: compare like-for-like scope, normalize spend by category, test the actual cost drivers, and bring that data into renewal talks. The payoff comes from using the same method across every property, not just a single deal.
The biggest risk is portfolio drift: several contracts creeping above market at the same time because nobody is tracking them as a group. Once you can see that drift, the fix is pretty simple. Use a regular review cycle, benchmark each category with the right unit, and document every approved rate.
Keep contracts, assumptions, and renewal dates in Trackado so your team can spot outliers faster and manage your contract renewals more effectively.
FAQs
How do I benchmark contracts across different hotel properties?
Centralize all agreements in a searchable digital repository, then sort them by portfolio, region, and property. Tag each contract the same way every time, with details like vendor category, contract value, and renewal date.
From there, compare standard metrics such as cost variance, spend under management, and unit costs. That makes it easier to spot pricing gaps, overspending, volume discount opportunities, and duplicate vendors that slip through the cracks. Tools like Trackado can help by pulling out key terms and flagging renewal dates.
Which contract terms usually hide the biggest extra costs?
The biggest extra costs in hotel vendor agreements often hide in automatic renewal clauses. Those clauses can quietly kick in, then bring price increases or tighter terms that no one spots until the next bill shows up.
Other common trouble spots include vague scope-of-work language, unclear pricing setups like blended or market-based rates without audit rights, surprise landed fees, and post-signature cost increases caused by scope creep or price drift.
When should I start benchmarking before a vendor renewal?
Start benchmarking at least 90 days before a vendor renewal. That gives your team room to check market rates, review how the vendor has performed, and start rebidding or renegotiating before the deadline starts breathing down your neck.
For high-value agreements, that extra time can help you avoid rushed calls and expensive auto-renewals. Tools like Trackado can send alerts at 90, 60, and 30 days, so your team stays ahead of the date instead of scrambling at the last minute.