Most contract problems start with 7 things you can track right away: renewals, missed obligations, missing owners, policy exceptions, insurance expirations, approval delays, and supplier risk flags.
If I had to sum up the article in one line, it would be this: a good contract compliance dashboard helps you spot risk before it turns into lost money, audit issues, vendor trouble, or missed deadlines. The metrics that matter most are the ones that show what needs action now, who owns it, and how much is at stake.
Here’s the short version:
- Upcoming renewals help you avoid unwanted auto-renewals and missed notice dates.
- Missed obligations show where teams are falling behind on contract duties.
- Contracts without owners point to gaps in accountability.
- Policy exceptions show where teams are working outside standard rules.
- Expiring insurance documents help you catch coverage gaps before work continues without proof of insurance.
- Approval delays show where contract reviews are getting stuck.
- Supplier risk flags help you see vendor trouble early.
What makes these metrics useful? Simple: they should be based on clean data, tied to a clear next step, and easy for both teams and leaders to review. For example, a dashboard is far more useful when it shows 30/60/90-day deadlines, owner assignment rates, cycle times, and percentages like 95% on-time completion or under 5% SLA breach rates.
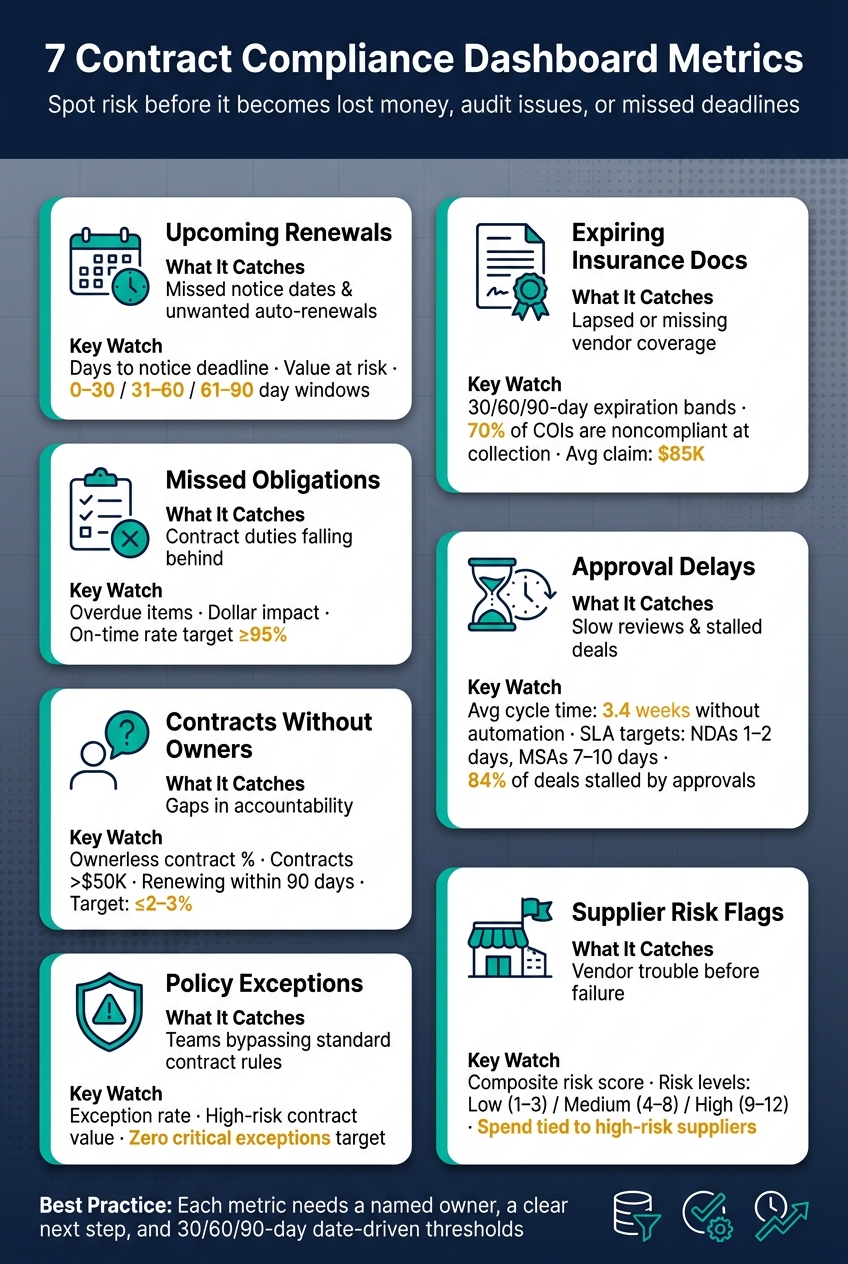
7 Contract Compliance Dashboard Metrics: What to Track & Why
Quick Comparison
| Metric | What it helps you catch | Main thing to watch |
|---|---|---|
| Upcoming renewals | Missed notice dates, unwanted renewals | Days to notice deadline, value at risk |
| Missed obligations | Work not completed on time | Overdue items, dollar impact |
| Contracts without owners | No clear accountability | Ownerless contract %, renewal risk |
| Policy exceptions | Contracts outside policy | Exception rate, high-risk value |
| Expiring insurance docs | Lapsed or missing vendor coverage | 30/60/90-day expirations |
| Approval delays | Slow reviews and stalled deals | Average and median cycle time |
| Supplier risk flags | Vendor trouble before failure | Risk score, spend tied to high-risk suppliers |
If you’re building or cleaning up a dashboard, I’d start with these seven and keep the view simple, action-based, and date-driven.
sbb-itb-49df6ae
What Makes a Contract Compliance Metric Worth Tracking
A compliance dashboard metric earns its spot only when it helps teams see risk early, move fast, and trust what they’re looking at. If a metric doesn’t help people act, it’s just noise. It belongs on the dashboard only if it brings risk to the surface in time, supports quick action, and is entered the same way every time.
The best metrics look forward, not backward. In plain terms, they work as leading indicators. They show trouble while there’s still time to fix it, not after the damage is done. A 90-day view helps with planning. A 60-day view shows whether things are moving in the right direction. A 30-day view points to work that needs attention now.
None of that works if the data underneath is incomplete. If fields like contract owner, effective date, renewal date, expiration date, and obligation due dates are missing or entered in different ways, the dashboard can miss risk or send bad alerts. Use one date format across all records, such as MM/DD/YYYY, so every person reads the same date the same way.
A metric also has to work for two groups at once. Frontline teams need to know the next step. Leaders need trend data they can scan fast. If a metric only helps one group, people either ignore it or read too much into it.
With that standard in place, start with the metric that often creates the first compliance risk: upcoming renewals.
1. Upcoming Renewal Pipeline
Risk Exposure
The biggest risk usually isn’t the end date itself. It’s the notice deadline.
A contract that ends in 120 days but needs 90 days’ notice is far more urgent than one that ends in 30 days with a 10-day notice window. That’s why the pipeline should group renewals into 0–30, 31–60, 61–90, and 91–180 day windows. It should also show auto-renewal status, notice deadline, and contract value.
That setup makes one thing plain: the total dollar value at risk across agreements that need action before they roll over or expire. Strategic suppliers and high-spend contracts should stand out on their own, not get lost in a flat list sorted by date.
Actionability
Visibility is only useful if it leads to a clear next move.
The view should show:
- Owner
- Days to the notice deadline
- Status: needs review, approved to renew, in negotiation, or notice sent
That way, the pipeline works like a work queue, not just a calendar.
And if a contract has fewer than 30 days left, with no logged action and no owner assigned, that’s not just another row in a dashboard. It’s an escalation trigger.
Data Source Reliability
This only works if the core fields are stored in a structured, consistent format. That includes renewal date, notice period, auto-renewal clause, contract owner, and spend amount.
When those details live in PDFs or scattered spreadsheets, the dashboard can miss renewals or show the wrong ones. A secure digital contract storage system – covering amendments and side letters too – keeps the pipeline accurate.
It also helps to check the contract repository against finance or procurement records from time to time. That’s a simple way to catch active agreements that slipped through the cracks.
Executive Reporting Value
For leadership, the view should be tighter and more direct: total renewals by time period, combined contract value, share with owners, and the highest-risk decisions.
Once renewals are easy to see, the next issue shows up fast: whether active obligations are actually being met.
2. Missed Obligations
Risk Exposure
Once renewals are visible, the next compliance gap is simple: are active obligations being met?
Missed obligations show where contract commitments are breaking down in day-to-day work. Financial misses, like overdue payments or lost discount tiers, cut into margin. Operational misses, like SLA breaches, hurt service quality. Regulatory misses, like reporting deadlines or certification lapses, can lead to fines.
For each miss, show the estimated dollar impact, a running total of exposure, and a severity rating. That gives teams a clear view of what the problem costs, not just the fact that it exists.
Actionability
This metric should push action, not sit on a dashboard. Every miss needs:
- An owner
- A remediation deadline
- A logged next step
That way, compliance teams can show follow-through instead of just flagging issues. High-impact misses tied to regulatory deadlines, key customers, or critical suppliers should move up to legal or senior management.
Repeated misses by obligation type usually point to a process problem. It may be a contract automation issue, a weak handoff, or a reminder system that isn’t doing its job. Track remediation completion rate alongside total misses so teams can see both backlog and response.
That workflow only works when obligations are captured in structured form from the start.
Data Source Reliability
Missed obligations are only visible when they exist as structured data. If obligations are buried in PDFs with no owner, due date, or status field, they’re easy to miss.
Extract obligations at signing and store them as structured fields, including:
- Description
- Due date
- Owner
- Type
- Consequence
Then reconcile that data on a set schedule against billing records, ticketing logs, project trackers, and other operational systems. This helps confirm whether each obligation was fulfilled.
Executive Reporting Value
Leadership doesn’t need a line-by-line list. They need trend direction, financial exposure, and where risk is piling up.
Show missed obligations by month or quarter, total estimated exposure in USD, and a breakdown by business unit or contract type. Add a completed-vs.-overdue view by criticality for a fast read on performance.
If missed obligations show execution gaps, the next question is whether any contracts lack a clear owner.
3. Contracts Without Owners
Risk Exposure
When obligations slip, the problem is often simple: no one owns the contract.
An unowned contract is an active agreement with no assigned person accountable for it. You should treat inactive or unclear owners the same way. The risk is both operational and financial. Without a clear owner, renewals, notice deadlines, and insurance checks can fall through the cracks.
That risk climbs fast when the agreement is high-value or tied to core operations. Two unowned vendor contracts connected to day-to-day operations are a material risk.
Actionability
Don’t show ownerless contracts by count alone. Show them by value and how close they are to renewal. Put the spotlight on contracts over $50,000 and those renewing within 90 days. That gets you to the group most likely to create compliance exposure.
Ownership should be assigned within 3–5 business days and the contract should move into a controlled review process. Once that happens, teams can sort out true exceptions from routine compliance gaps.
Data Source Reliability
Use the contract repository as the source of truth, then cross-check owner fields against the employee directory. Contracts pulled in from legacy systems or shared drives often come in with missing owner fields. And sometimes the named owner is no longer with the company, which makes the record look assigned when, in practice, no one is managing it.
Regular checks against current employee directories and department mappings help keep this metric trustworthy.
Executive Reporting Value
For leadership, this is a governance metric. The table below shows the key views:
| Metric | What It Measures |
|---|---|
| Ownerless contract count | Number of active contracts with no named owner |
| Ownerless contract value | Total dollar value of unowned agreements |
| Ownership coverage | % of active contracts with a named owner |
| Renewal risk without owner | Contracts near notice dates with no owner assigned |
Once ownership is clear, the next control is whether any contracts need documented policy exceptions. Next, look at where teams are bypassing policy instead of following it.
4. Policy Exceptions
Risk Exposure
A policy exception is any approved or unapproved departure from standard contract terms or approval rules. That can mean non-standard payment terms, a weaker liability cap, missing data protection language, or a skipped approval step.
The main risk here is concentration. A small number of high-value exceptions can create more exposure than a long list of minor ones. That’s why contract value under exception often tells you more than exception count by itself. A few large contracts with major legal or security changes can carry more risk than many low-value deals with small commercial changes.
This gets more serious in contracts that involve sensitive or regulated data. If an exception weakens data protection commitments, incident notification timelines, or security requirements, exposure can increase under privacy laws that apply.
Actionability
This metric only leads to action if it has clear thresholds and clear owners. For example, require Legal review and CFO approval for any deal over $100,000 with a high-risk exception, such as a reduced liability cap, changed indemnity, or a missing security addendum.
Initial approval isn’t enough. Every high-risk exception should also have a remediation plan with a set deadline. Add a target review date, track exceptions that are past due, and review open exceptions again at renewal. That gives teams a natural chance to pull terms back toward standard language.
Data Source Reliability
Capture exceptions as structured fields in the contract record, not as loose notes in email threads. Use dropdowns, checkboxes, or standard tags. Examples include:
- liability cap below 1x annual fees
- security schedule modified
- payment terms beyond net 30 policy
Those fields should be required before a contract can move to approval or signature. It also helps to run quarterly audits that compare executed contracts against recorded exceptions, so anything missed can be caught.
Executive Reporting Value
For leadership, the point is simple: show where risk is clustered without forcing anyone into a line-by-line contract review. The table below gives the core views:
| Metric | What It Measures |
|---|---|
| Policy Exception Rate (PER) | Active exceptions ÷ total active contracts in scope |
| Contract value under exception | Total dollar value of contracts with at least one high-risk exception |
| Severity-weighted exception rate | Risk-weighted exceptions ÷ total active contracts |
| Overdue review rate | Exceptions past their review date ÷ total active exceptions |
| Repeat exception rate | Percentage of exceptions with the same root cause in the last 12 months |
If the same exception keeps showing up, flag it for the General Counsel or CFO. Repeated deviations usually point to a process problem.
Once exceptions are visible, check whether required insurance documents are still current.
5. Expiring Insurance Documents
Risk Exposure
Insurance runs on its own timeline, even when the contract doesn’t change.
A vendor agreement might last three years, while the policy or certificate of insurance (COI) renews on totally different dates. That’s why the dashboard needs to track expiring COIs, lapsed coverage, and remediation time. This is often where coverage slips away quietly while the contract keeps moving.
Claims involving uninsured vendors on commercial properties can run into tens of thousands of dollars, and insurers generally have no legal obligation to notify certificate holders when a policy lapses. A significant share of certificates of insurance collected during vendor onboarding contain errors or gaps at the time of collection, expired dates, wrong coverage limits, or missing endorsements. So this isn’t some edge case. It’s common.
There’s another problem: insurers generally have no legal obligation to notify certificate holders when a policy is canceled or lapses. If no one is tracking expiration dates, the first sign of trouble may come when a claim gets denied. That’s why this metric only matters if each expiration date has alerts and escalation rules tied to it.
Actionability
Use simple status bands tied to time:
- 90 days: Monitoring
- 60 days: Action Required
- 30 days: Critical
Give one person clear ownership for chasing renewals and checking coverage. At 90 days, auto-create a task to request an updated COI or renewal binder. At 30 days, escalate to procurement or legal, and pause new purchase orders or work until updated documents are in hand.
Data Source Reliability
Stale certificates are the most common point of failure.
A COI collected during vendor onboarding only proves that coverage existed on that specific date. It does not prove the policy is still active today. Store the COI and policy record with the contract, not buried in email threads or random folders.
Each insurance record should include:
- Carrier name
- Policy type
- Policy number
- Coverage limits
- Effective date
- Expiration date
- Certificate status
- Whether your organization is listed as an additional insured
If those fields are missing, the dashboard can miss expiring coverage or show compliance that isn’t there.
Executive Reporting Value
Leadership needs a clear view of where lapsed coverage is piling up and which teams are slow to fix it. The most useful report shows the total annual contract value tied to expiring or lapsed insurance, broken out by vendor tier or department.
| KPI | What It Measures |
|---|---|
| Contracts with insurance expiring in the next 30/60/90 days | Number and percentage of active contracts with near-term coverage risk |
| Noncompliant COI rate | Percentage of active vendor COIs that are expired, incomplete, or below required limits |
| Contracts with lapsed coverage | Count of active contracts currently operating without verified insurance |
| Time to remediation | Average days from expiry alert to receipt of updated documentation |
Once insurance is current, the next bottleneck is how long approvals take.
6. Approval Delays
Risk Exposure
Even if obligations and insurance are up to date, slow approvals still create compliance and revenue risk.
Every contract sits in line for approval, and that lag costs both time and money. Delays can hold up compliance sign-off, push revenue out, and slow supplier onboarding. In a DocuSign study, 84% of respondents said approvals had stalled deals. Without automation, the average time from request to signature is about 3.4 weeks.
Actionability
Start by breaking approval time into clear stages. Track intake, legal review, cross-functional review, final approval, and e-signature. Measure each stage in business days, then set SLAs by contract type.
For example:
- 1–2 business days for standard NDAs
- 3–5 business days for low-risk commercial contracts
- 7–10 business days for higher-value or moderately complex MSAs and SOWs
When an SLA is missed, flag it right away. Alerts and escalation rules help push overdue items forward before they sit too long. For standard, low-risk agreements, fast-track workflows can cut congestion and let reviewers spend their time where it matters most.
Track delays by stage, then show leadership where the bottleneck is. That makes the problem a lot easier to fix.
Data Source Reliability
You can only measure approval delays if every step leaves a timestamp in one central system.
That means each stage – intake, legal review, finance review, final approval, and e-signature – should be logged automatically through a structured workflow. At intake, require fields like contract type, value, risk level, and department. That helps cut rework and keeps cycle-time data from getting skewed.
It also helps to run periodic audits. Comparing contract records against finance system data can confirm that the record is complete and that the timing data is accurate.
Executive Reporting Value
Leadership usually doesn’t want process trivia. They want to see business impact.
The most useful view connects cycle time to revenue and pipeline risk.
| KPI | What It Measures |
|---|---|
| Average time from request to signature | End-to-end approval cycle time, by quarter and contract type |
| % of contracts missing approval SLA | Share of contracts exceeding defined stage-level time targets |
| Bottleneck approver list | Approvers with the highest volume of overdue pending items |
| Deals at risk due to approval aging | Contracts in approval >X days that may miss go-live or compliance deadlines |
Once approvals start moving faster, supplier risk flags can show which vendors need a closer look before execution.
7. Supplier Risk Flags
This last metric helps teams spot trouble before it spills into the contract.
Risk Exposure
A supplier risk flag is any sign that a vendor may be drifting toward trouble. It can point to operational, financial, compliance, or reputational risk before the business feels the impact. Common flags include late delivery patterns, sanctions matches, adverse media, credit downgrades, regulatory enforcement actions, and cybersecurity incidents.
Supplier risk flags are predictive; they show which vendors are likely to cause the next issue. That matters when a single-source supplier failure can stall operations or trigger compliance issues.
To measure exposure, give each supplier a composite risk score that blends financial health, delivery performance, compliance status, and security posture. It also helps to flag dependency concentration. If a supplier is your only source for a critical input, that’s a built-in risk and should stand out on its own.
Actionability
Once a supplier is flagged, the dashboard should make two things obvious: who owns the response and what happens next.
A simple probability-impact scale works well:
| Risk Score | Risk Level | Required Action |
|---|---|---|
| 1–3 | Low | Monitor |
| 4–8 | Medium | Review quarterly |
| 9–12 | High | Mitigation plan within 30 days |
For high-severity flags, like a sanctions match, an adverse media spike, or a credit downgrade, the response should kick in automatically. Notify the contract owner, request updated documentation, and require risk or legal approval before renewal. For medium-risk flags, a quarterly review cycle is usually enough.
Data Source Reliability
Supplier risk flags work best when the contract record acts as the base and outside data adds another layer of signal. The most dependable dashboards pull from both internal records – such as delivery logs, obligation tracking, and policy exception records – and external sources, including credit ratings, sanctions lists, adverse media, and security assessments.
Insurance expiry dates, certification renewal deadlines, obligation milestones, and policy exception records should all sit in one structured system, with automated reminders set well ahead of each deadline.
Track coverage by supplier tier too. If a supplier has no documented risk profile, that alone is a flag.
Executive Reporting Value
Leadership needs a quick read on where the biggest exposure sits. The most useful executive view brings together risk tier distribution – how many suppliers fall into high, medium, or low risk – the top 10 highest-risk vendors with key flags summarized, and total annual spend tied to high-risk suppliers.
Add a trend line that shows whether overall supplier risk scores are getting better or worse quarter over quarter, and leaders have what they need to make decisions on renewals, renegotiations, or supplier diversification.
With the seven metrics defined, the next step is arranging them into a single dashboard view.
How to Organize These Metrics in One Dashboard
Set up the dashboard around the risks teams need to handle first. That keeps it readable and makes it easier to act on. A simple way to do that is to place the seven metrics into four blocks, so each team sees the slice of risk it can actually work on.
| Dashboard Block | Metrics Included | Primary Users |
|---|---|---|
| Renewal & Value Risk | Upcoming renewal pipeline, renewals by value band | Legal, Procurement, Finance |
| Obligation & Documentation Compliance | Missed obligations, expiring insurance documents | Operations, Risk, Legal |
| Governance & Workflow Efficiency | Contracts without owners, approval delays, policy exceptions | Legal, Procurement |
| Supplier Risk | Supplier risk flags and related risk signals | Procurement, Risk, Finance |
This setup gives each team a tighter view of where risk tends to pile up. Add role-based filters and saved views so Legal, Procurement, Finance, and Operations each land in the right context instead of digging through one giant screen.
Set thresholds before launch. Contracts expiring within 30, 60, or 90 days should show up in separate tiles based on the lead time required to respond. “Overdue” should mean any item past its due date, with severity bands at 7, 30, and 60 days. Put these rules in a shared metric catalog so every team reads the numbers the same way. Once the layout is in place, you can map the formulas behind each tile.
Segmentation is what turns raw totals into something useful. One missed obligations count, by itself, doesn’t say much. Break it out by supplier, department, contract type, or value, and patterns start to show fast. Use value bands like under $10,000, $10,000–$100,000, and over $100,000 to surface material exposure. That makes the dashboard easier to scan and a lot easier to manage.
KPI Views and Formulas to Include
Once the dashboard blocks are set, the next step is simple: define how each tile is calculated. Every metric should show two views:
- a count view to show backlog
- a rate or percentage view to show trend
That split matters. Counts tell you how much work is sitting there. Rates show whether the process is getting better or slipping.
Use the table below as the baseline setup.
| Metric | Count View | Rate / Percentage View | Target Threshold |
|---|---|---|---|
| Upcoming Renewal Pipeline | Contracts renewing in the next 30, 60, and 90 days; total value at risk | % of renewals with an assigned owner and action plan | 80–90% with a defined next action ≥60 days out |
| Missed Obligations | Open and overdue obligations aged 1–30, 31–60, and 61+ days | On-time fulfillment rate = obligations completed on or before due date ÷ total obligations due in the period × 100 | Target ≥95%; below 80% signals a process failure |
| Contracts Without Owners | Active contracts with no owner assigned, broken down by department | % ownerless = blank owner field ÷ total active contracts × 100 | Interim target: ≤2–3%; long-term target: 0% |
| Policy Exceptions | Active exceptions by severity (critical, high, medium, low) | Exception rate = contracts with at least one exception ÷ total active contracts × 100 | Zero critical exceptions; high severity ≤2–3% |
| Expiring Insurance Docs | Certificates or policies expiring in the next 30, 60, and 90 days | Document coverage rate = valid required insurance documents ÷ contracts that require them × 100 | ≥95% of required documents current |
| Approval Delays | Contracts pending approval | Average cycle time = total business days from submission to final approval ÷ completed approvals; track median alongside average | 3–7 business days on average; ≥80% completed within SLA |
| Supplier Risk Flags | Suppliers with active risk flags; open remediation actions by supplier | SLA breach rate = breached SLAs ÷ total SLAs measured × 100; % of spend tied to high- or critical-risk suppliers | Breach rate under 5%; critical SLAs near zero |
For approval cycle time, track both the average and the median. If the gap between them is big, a small number of slow contracts is pulling the average up. That’s a useful warning sign, because the team may look fine on paper until a few stuck approvals throw off the picture.
Refresh renewal, obligation, and insurance metrics daily or weekly for operations. For trend reporting, use month-end and quarter-end snapshots. And keep two things fixed across reports: the active-contract denominator and the cutoff date. If those move around, the numbers can drift and comparisons stop being clean.
One more thing: these formulas only hold up if contract data is standardized and refreshed on schedule.
Where Trackado Fits for SMB Compliance Tracking
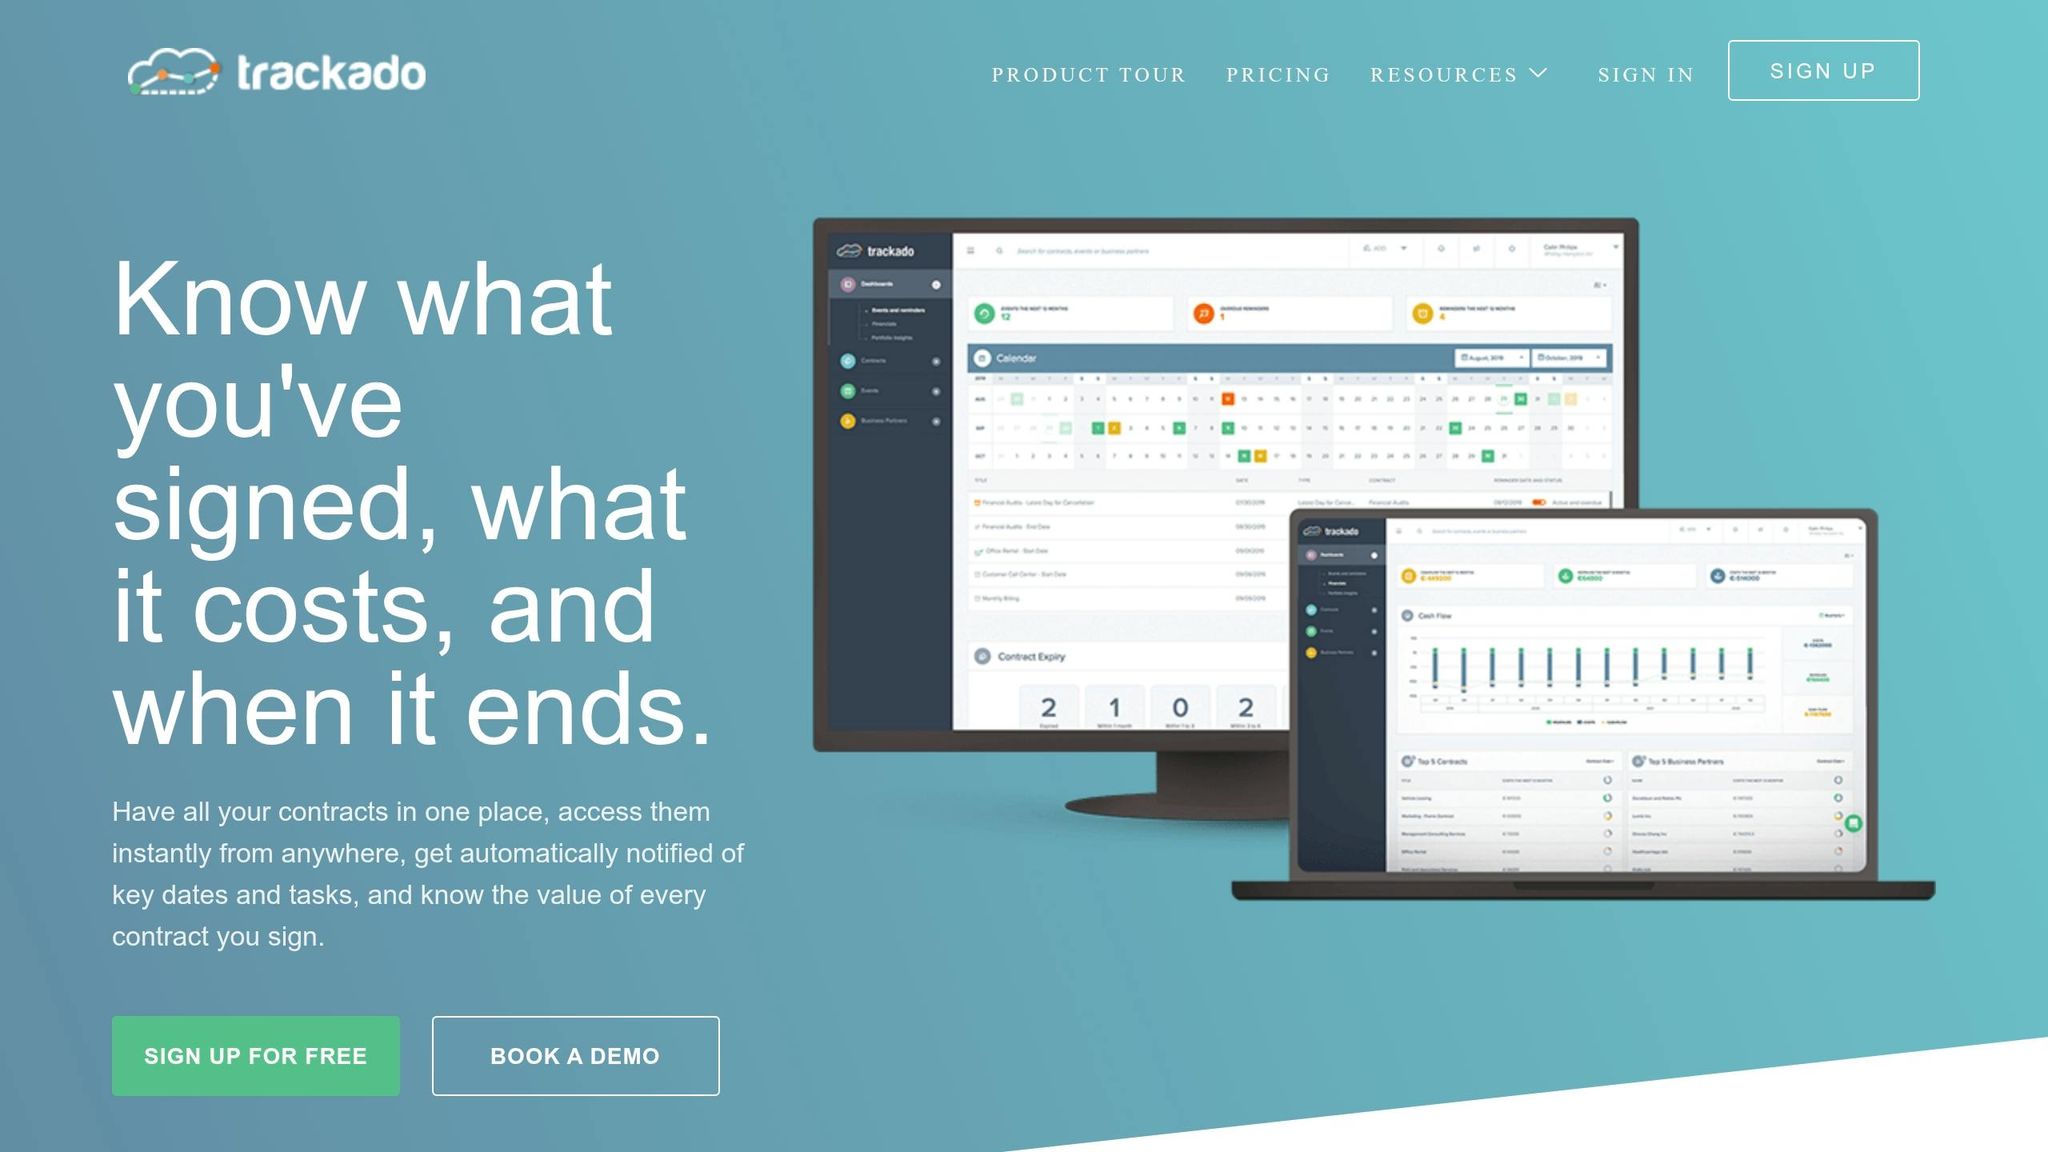
To keep the formulas and thresholds above reliable, the dashboard needs structured input and timestamped workflow data. These metrics only work when contract data is clean, current, and organized. Trackado gives SMBs one place to keep that data in order.
It starts with a structured contract repository that sorts agreements by partner, category, or department. That setup helps teams flag supplier risk and policy exceptions, segment contracts, and spot missing clauses. Trackado also supports linked master agreements, amendments, and SOWs.
For renewal, insurance, and obligation metrics, automated reminders track renewals, insurance expirations, and obligation milestones. That means fewer missed dates and less manual follow-up.
Custom fields store the compliance details teams need, like insurance limits, policy exception status, vendor risk notes, and regulatory attestations. Paired with assistive AI that pulls critical dates, values, and milestones from uploaded documents, teams spend less time entering data by hand and more time acting on what the dashboard shows. In practice, that supports renewals, obligations, exceptions, insurance, and supplier risk across the seven metrics above.
The same structure also supports the approval-delay metric. Approval workflows show where bottlenecks are happening by making it clear which agreements are waiting on legal, procurement, or finance review, and how long they’ve been sitting there. That gives teams a clear process trail for compliance reporting.
Conclusion
A contract compliance dashboard does its best work when it tracks the seven risks most likely to create exposure: renewals, obligations, ownership gaps, policy exceptions, insurance documents, approval delays, inefficient contract workflows, and supplier risk. Taken together, these give teams an early warning system before small issues turn into compliance failures.
Regular review is what makes the dashboard useful. Without that rhythm, it’s just a report. With it, risk becomes a routine management task instead of a last-minute scramble.
Visibility also drives accountability. Named owners, due dates, and risk statuses make it much harder for critical items to slip through. Start with the risks that create the most exposure, then add other metrics only after the core view is reliable.
FAQs
Which dashboard metric should I set up first?
Start with the notice deadline. It matters more than the expiration date because it’s your last chance to cancel, renegotiate, or renew before terms are locked in.
Once that’s easy to spot, add two or three high-impact metrics tied to your biggest risks, like upcoming renewals and obligation completion rates.
How often should I refresh compliance dashboard data?
Your compliance dashboard should update in real time so you’re always looking at current data. Platforms like Trackado can refresh on their own as contracts move forward.
That said, don’t rely on automation alone. Check the data every month, run a formal review during the first business week of each month, and use 30-, 60-, 90-, and 120-day outlooks to spot what’s coming. Then take a deeper look at your KPIs each quarter.
What data fields are required for accurate tracking?
For accurate tracking and dashboard reporting you can trust, record the same core fields for every contract.
That usually includes: contract name, counterparty, department or owning business unit, primary and backup owners, contract type, and priority.
You should also track start and end dates, renewal type, renewal date, notice period, payment schedule, contract value, and a standard status such as Active, Pending Renewal, or Terminated.
Use the MM/DD/YYYY format for all dates. This keeps reporting clean and cuts down on messy data issues later.